Executive Summary

1. Project Overview
Project Details

Cost Comparison Analysis

Impact Metrics Overview

2. Business Context & Problem

3. Strategic Decisions & Trade-offs
Strategic Trade-offs Analysis

Risk Management Framework

4. Goals & Success Metrics
North Star Metric Framework

Product Goals vs Results

Business Metrics Dashboard

5. Research & Discovery
Research Summary

Competitive Positioning Matrix

6. Personas & Jobs to be Done
Personas & Solutions Framework

7. Backlog & Prioritization (RICE + MoSCoW)
RICE Scoring Framework

Prioritized User Stories

MoSCoW Distribution

8. Roadmap & Sprint Planning (4 Sprints, 2-week each)
Sprint-by-Sprint Roadmap

Team Velocity Analysis

MoSCoW Prioritization

Key Milestones Timeline

9. Design & Prototyping
User Flow Validation

Wireframes Overview

10. MVP Build & Delivery
Tech Stack Overview

Complete MVP Feature List

Build Timeline and Checkpoints

Technical Details
Frontend
Vue.js, Tailwind CSS
Backend
PHP + MySQL
Shipped
- Search/filter, listing cards, detail page
- Realtor admin panel, contact form
- SEO basics
12. Hypothesis Testing & A/B Tests
Data-Driven Experiment Results

13. Iterations & Problem-Solving
Challenge Solutions Overview

Upload Performance

Search Optimization Journey

User Feedback Loop

14. Outcomes & Business Impact
Product Metrics (2 Months Post-Launch)
245
Weekly Active Listings
(Target: 200 WAL — 122% ✅)
(Target: 200 WAL — 122% ✅)
72%
Activation Rate
(≥1 listing in Week 1)
(≥1 listing in Week 1)
65%
Week 4 Retention
(Industry avg: 40%)
(Industry avg: 40%)
User Engagement Metrics
+40%
Avg Session Duration
(2.1min → 2.9min)
(2.1min → 2.9min)
3.2%
Browse → Contact Rate
(Industry: 1.8%)
(Industry: 1.8%)
+47%
Return Visitor Rate
(buyers come back 3x/week)
(buyers come back 3x/week)
Business Metrics
€15K
Potential MRR
(50 paid × €49 × 60% conv)
(50 paid × €49 × 60% conv)
€12
CAC per Realtor
(vs €45 on Funda)
(vs €45 on Funda)
58
Realtor NPS Score
(Promoters: 68%)
(Promoters: 68%)
Product Metrics Overview

Engagement & Business Impact

8-Week Growth Journey

15. Key Learnings & Reflections
What Worked vs What I'd Do Differently

Core Insights Impact

PM Lessons Framework

16. Future Vision (1-3 Years)
Product Roadmap Timeline

Strategic Growth Vision

Four Strategic Pillars

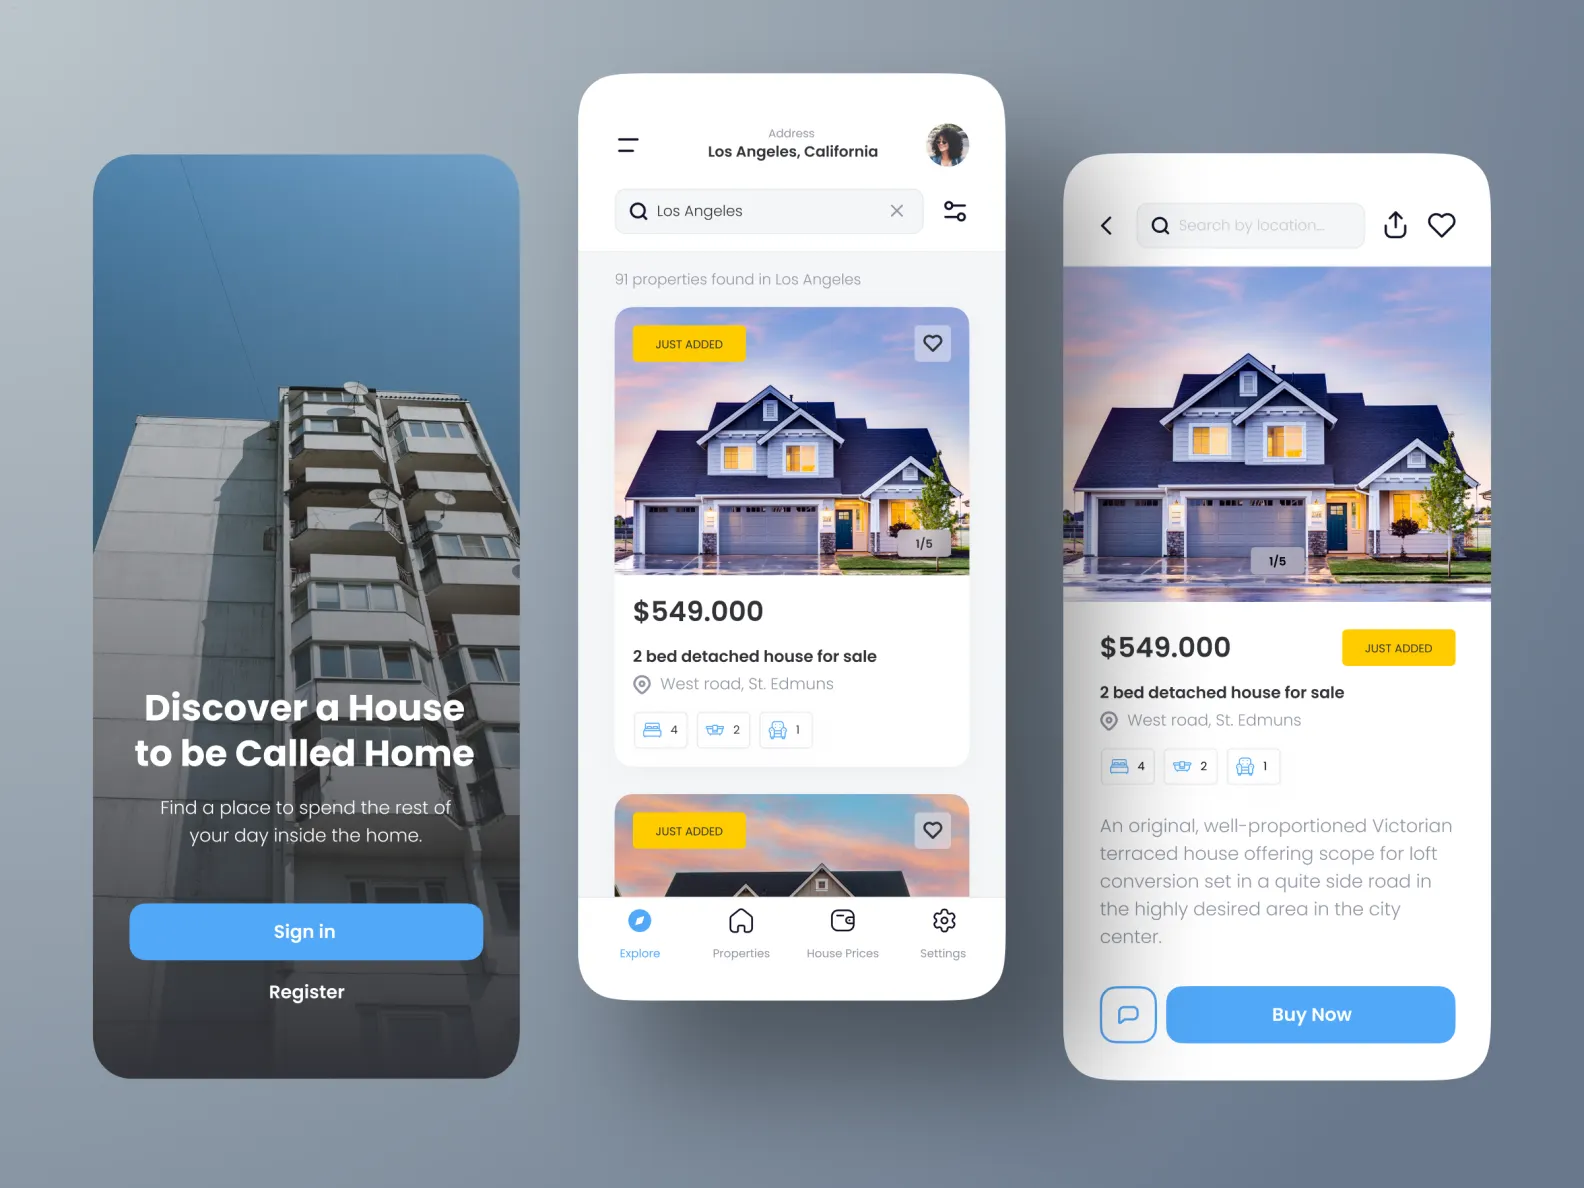
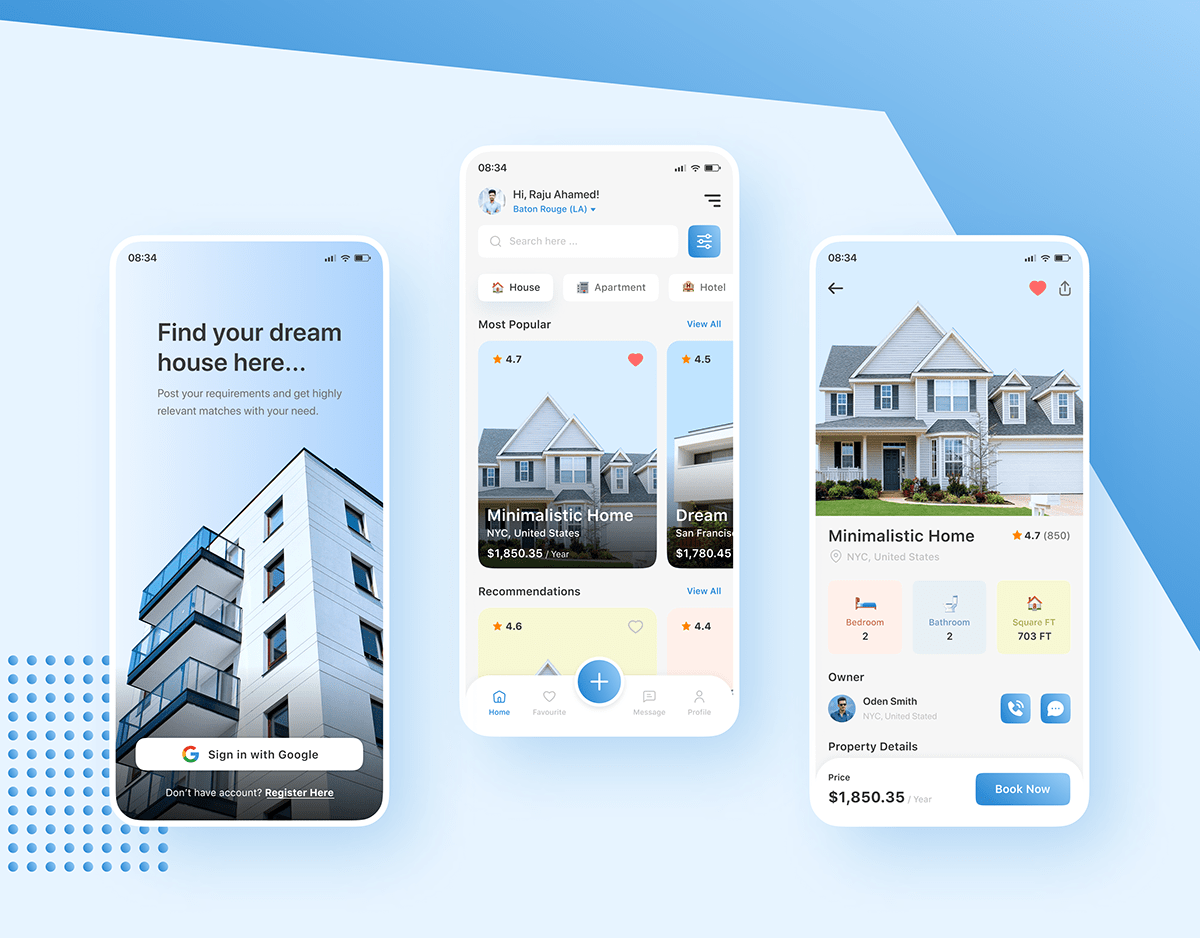
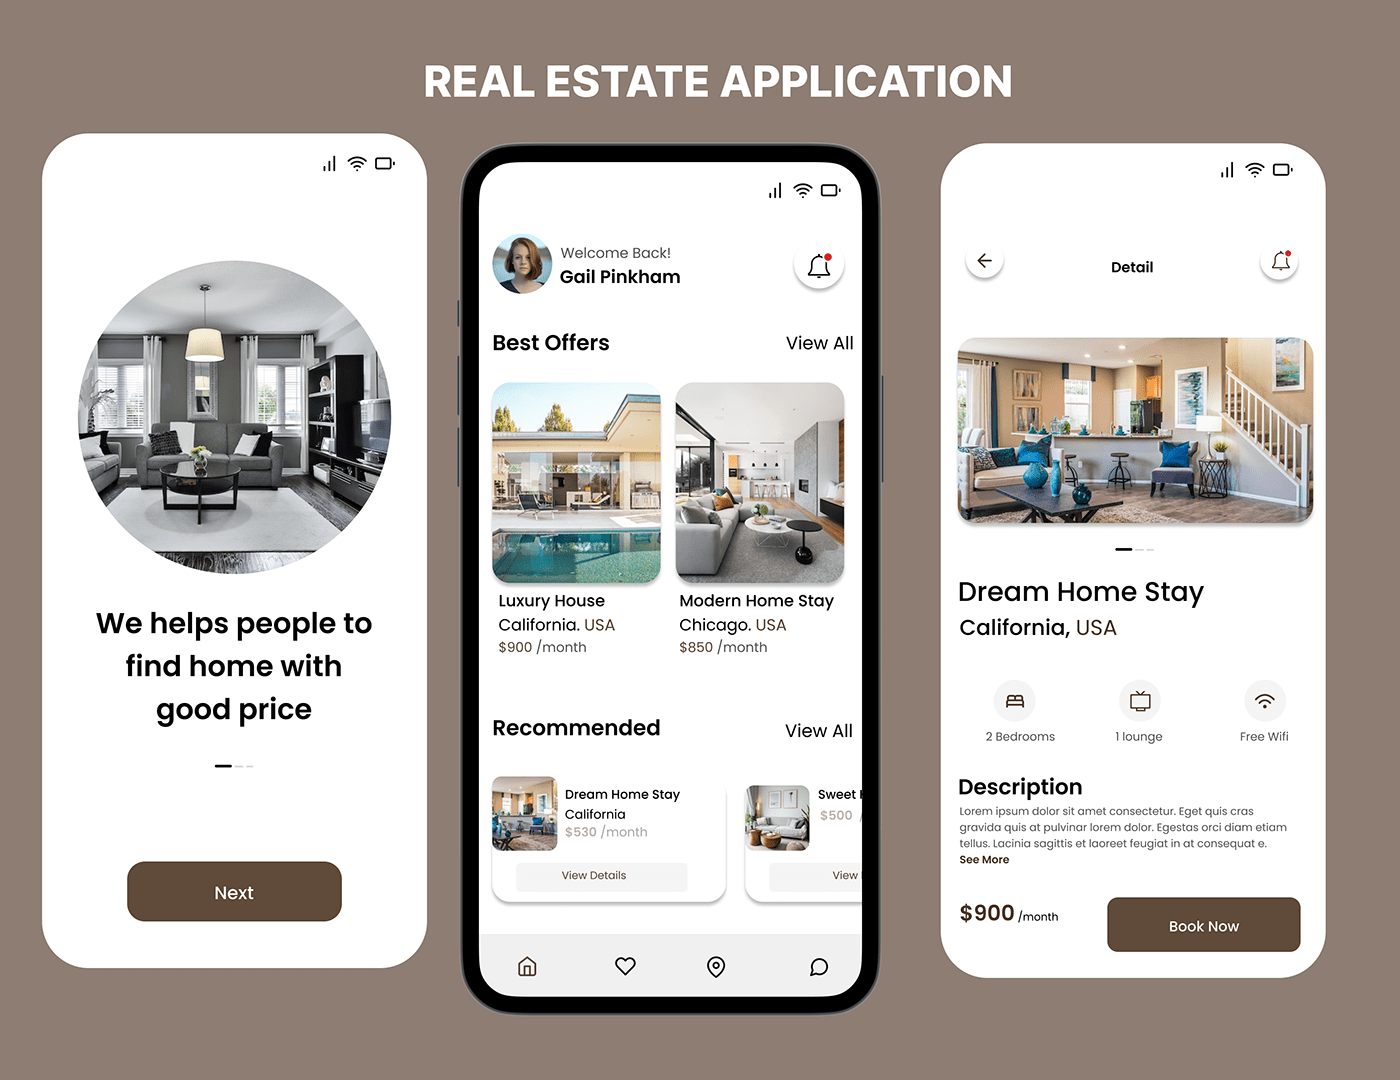
Screenshots